Accueil > Revue de presse > À l’étranger > Chart of the Day : Student Loans Have Grown 511% Since 1999 - Daniel (...)
 Chart of the Day : Student Loans Have Grown 511% Since 1999 - Daniel Indiviglio, The Atlantic, 18 août 2011
mercredi 24 août 2011, par
Daniel Indiviglio is an associate editor at The Atlantic, where he writes about the intersection of business, finance, economics, and politics. Prior to joining The Atlantic, he wrote for Forbes. He also worked as an investment banker and a consultant.
You think the housing bubble was enormous ? Meet the education bubble. On Wednesday, an article here by Andrew Hacker and Claudia Dreifus explained the debt crisis at American colleges. But some startling statistics will help to make their analysis a little more tangible. The growth in student loans over the past decade has been truly staggering.
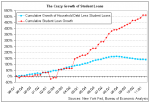
Here’s a chart based on New York Federal Reserve data for household debt. The red line shows the cumulative growth in student loans since 1999. The blue line shows the growth of all other household debt except for student loans over the same period.
This chart looks like a mistake, but it’s correct. Student loan debt has grown by 511% over this period. In the first quarter of 1999, just $90 billion in student loans were outstanding. As of the second quarter of 2011, that balance had ballooned to $550 billion.
The chart above is striking for another reason. See that blue line for all other debt but student loans ? This wasn’t just any average period in history for household debt. This period included the inflation of a housing bubble so gigantic that it caused the financial sector to collapse and led to the worst recession since the Great Depression. But that other debt growth ? It’s dwarfed by student loan growth.
How does the housing bubble debt compare ? If you add together mortgages and revolving home equity, then from the first quarter of 1999 to when housing-related debt peaked in the third quarter of 2008, the sum increased from $3.28 trillion to $9.98 trillion. Over this period, housing-related debt had increased threefold. Meanwhile, over the entire period shown on the chart, the balance of student loans grew by more than 6x. The growth of student loans has been twice as steep — and it’s showing no signs of slowing. [1]
Obviously the number of students didn’t grow by 511%. So why are education loans growing so rapidly ? One reason could be availability. The government’s backing lets credit to students flow very freely. And as the article from yesterday noted, universities are raising tuition aggressively since students are willing to pay more through those loans.
This student loan growth sure looks unsustainable. But it’s hard to see how this bubble’s inevitable pop might look. Ultimately, it might look more like a balloon slowly deflating, if a large portion of college graduates decide to strategically default on their debt over time.
Pour lire la suite.
[1] You might notice that student loan growth was actually flat in the second quarter. The same thing happened in the second quarter of last year, so this is likely a seasonal effect. We should expect growth to resume this quarter.


